
Using the Reporting Module
When accessing the Reports module, you’ll be met with four tabs; Report Writer, Executive Summary, Leads, and Eblast. Below, we will go through each section and explain how they work.
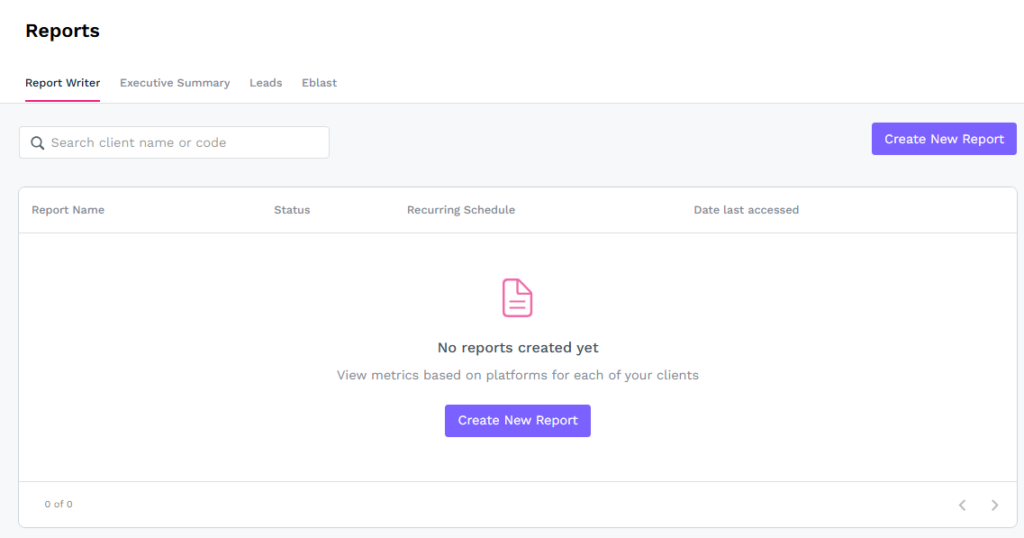
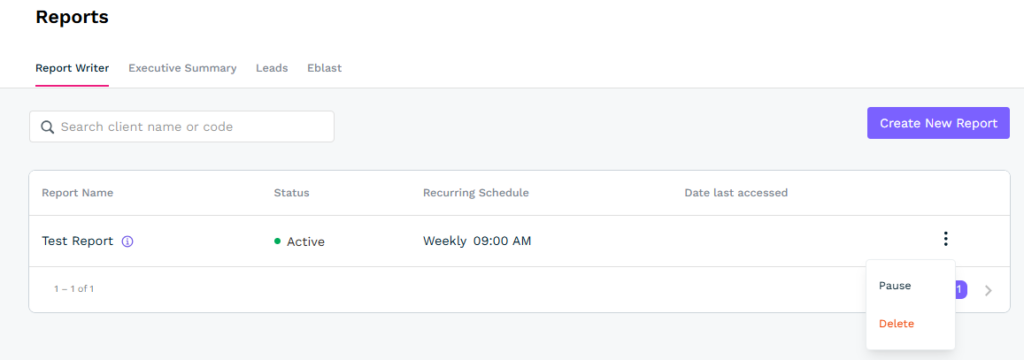
Report Writer
As shown in the image above, the Report Writer tab offers a button to create a new report if one has not previously been created. When the button has been clicked, you will be prompted to enter a report name. Click the Create Report button and another prompt will appear asking you which client this is for. Select the client from the drop-down list and select the platforms that have been integrated with the client account. The prompt box will now expand and ask you what metrics and time period you’d like to pull.
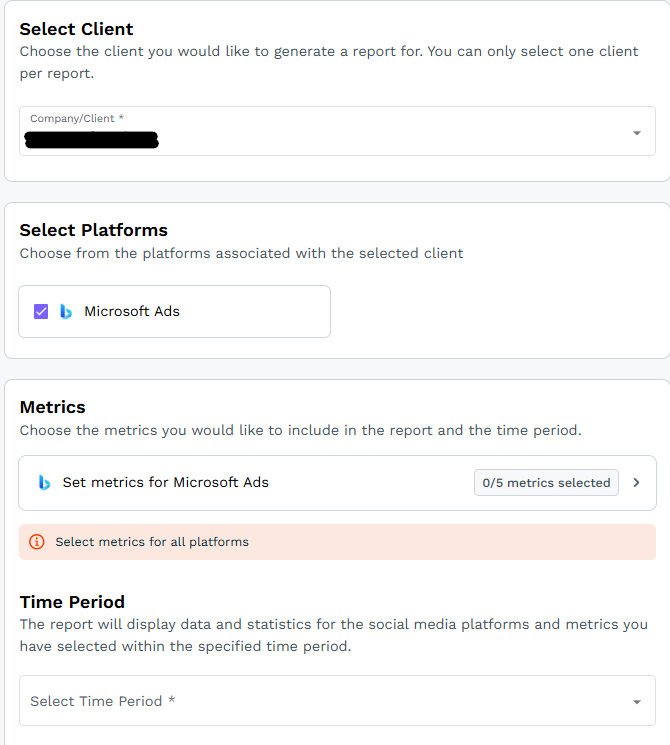
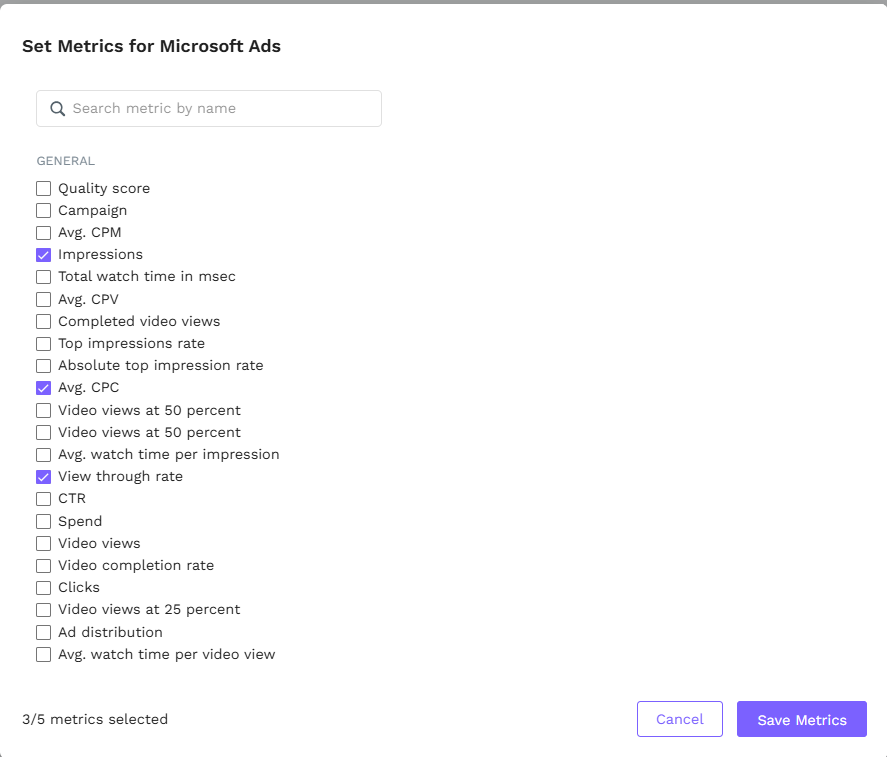
Click the Metrics button and a new window will pop-up, prompting you to select the individual metrics you’d like to import. You can select up to 5 metrics to include on the report. Click Save Metrics when done.
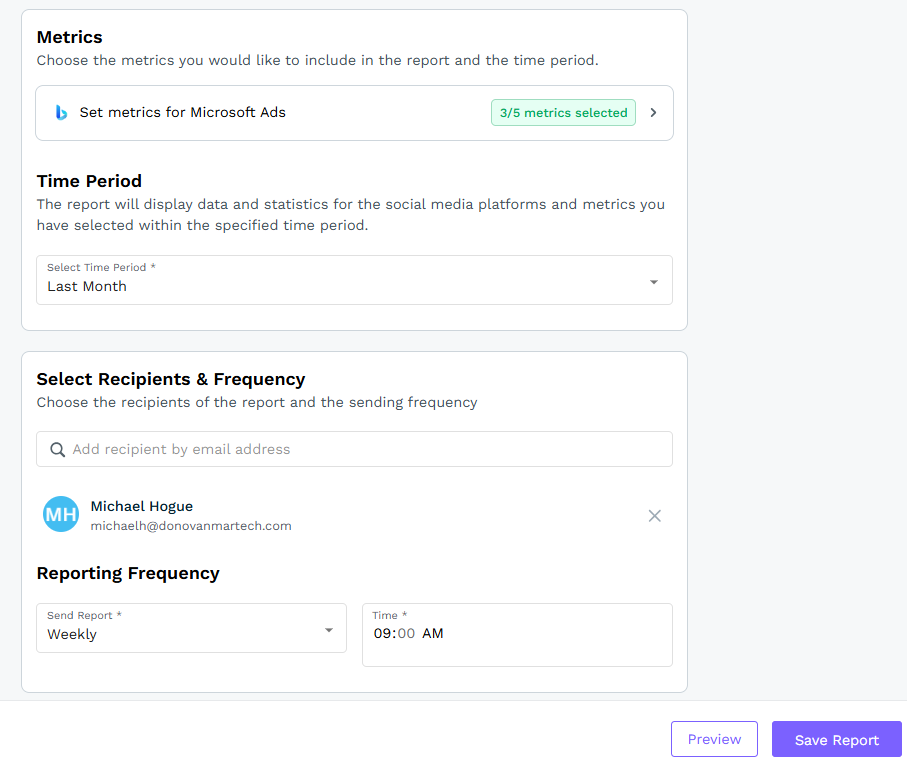
This will take you back to the previous screen, showing that your metrics have been selected, and prompting you to select the time period, recipients, and frequency that the report is sent. When done, click Save Report.
Your report is now set to run at the interval that you specified and will be visible in the Report Writer tab. From here, you can pause or delete the report.
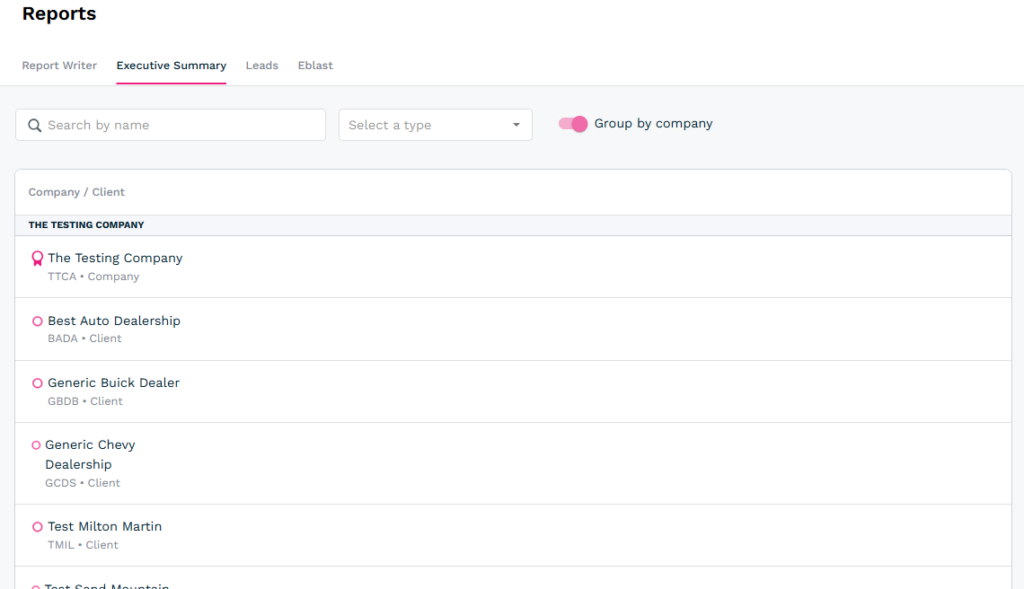
Executive Summary
The Executive Summary is used to aggregate all of the data points that are either integrated with DealerVerse or are manually entered into the Leads and Eblast sections. When you first click on the tab, you will be required to select the company or client you want to pull reports for. Once selected, you’ll be able to generate a report.
Once you’ve selected the client account you want, you will see a few options to choose from. The calendar selections can be used in conjunction with the View button. Once the month and year are selected, click View to be able to generate the report. Click the Generate button to have the system aggregate the data from Google Analytics, Google Ads, and any lead or eblast data that is manually entered. When the report is ready, click the Save button to create a PDF. Once completed, it can be downloaded via the Download Report button.
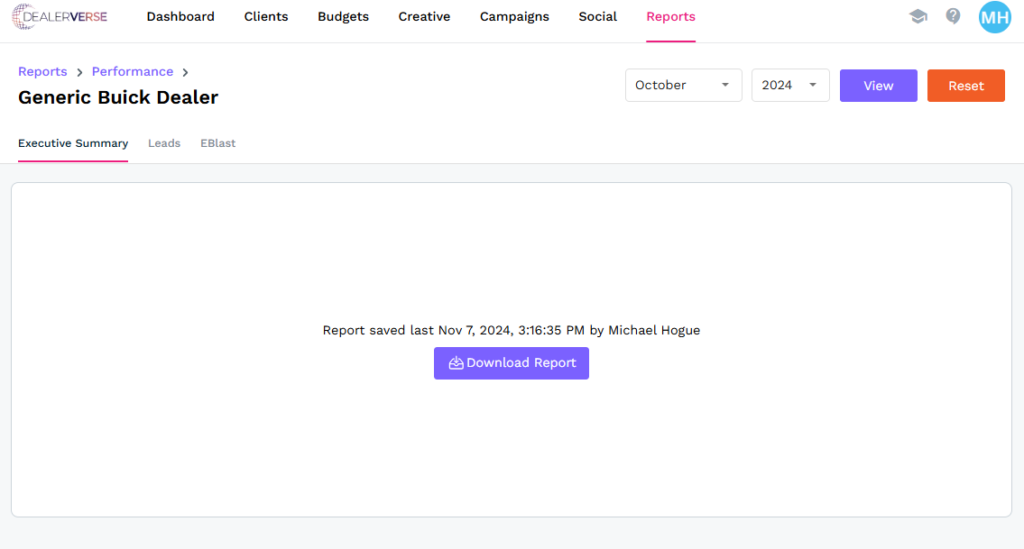
If the Executive Summary report needs to be revised, click the Reset button so changes can be made. At this point, you can also select a different month and year to view another Executive Summary, if necessary.
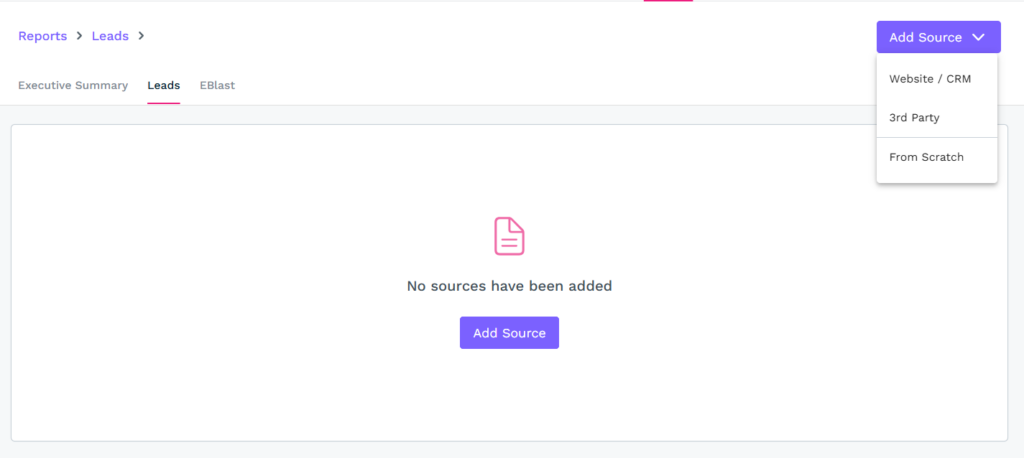
Leads
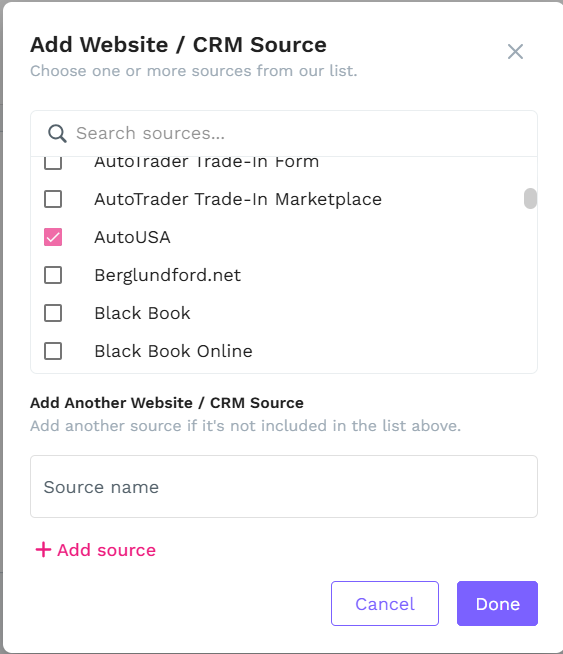
The Leads tab is used to add leads data points from sources that can’t be pulled in through Google Analytics or Google Ads integrations. For example, if a 3rd party system like AutoTrader is generating leads, sources can be added to the Leads tab to be able to manually keep track of it. To start, click the Add Source button in the top right and a drop-down will appear. You will be given 3 options; Website / CRM, 3rd party, and From Scratch.
Website / CRM and 3rd Party operate in the same way. You’ll have a list of pre-entered sources at the top, You can search through the list and find the appropriate source or you can add another source manually. When completed, just click the Done button.
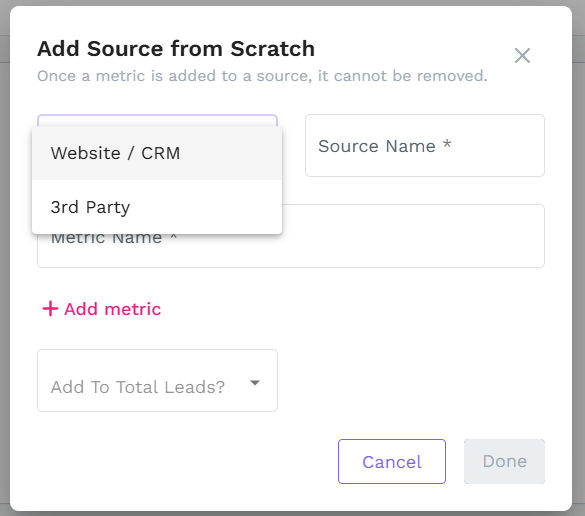
The From Scratch option in the drop-down is a little bit different than the other two options in that you will not have any previously created entries to select from. Simply choose Website / CRM or 3rd party from the Select Source Type drop-down, enter a Source Name, and then add your Metric Name. The difference between a source and a metric is that the source is the application the data is coming from and the metric is the individual data point. You could have multiple metrics for one source, but not the other way around.
Eblast
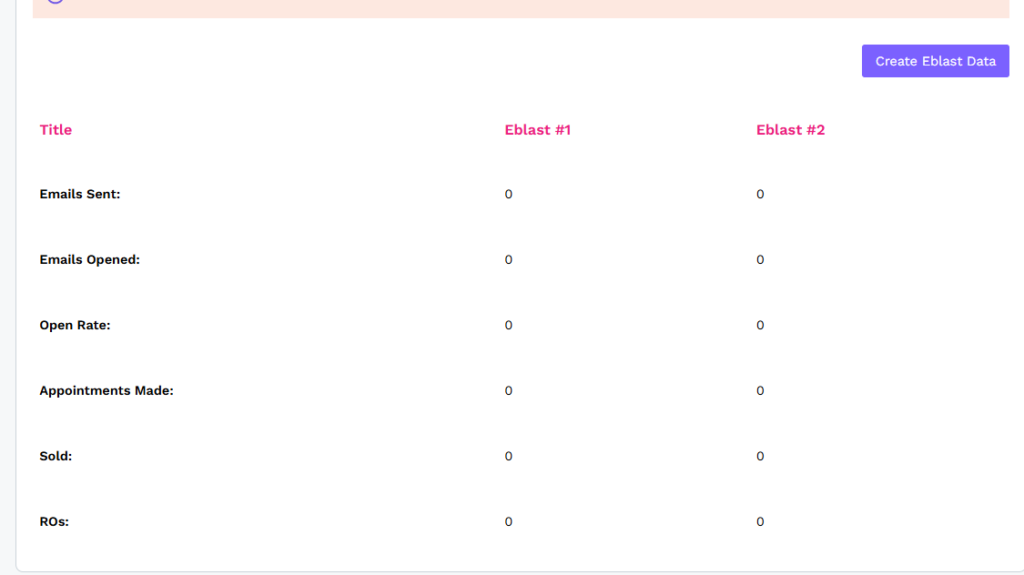
The eblast section is for reporting on any marketing emails that are sent out to a list. The fields that you will have the ability to report on are; Emails Sent, Emails Opened, Open Rate, Appointments Made, Sold, & ROs (Repair Orders). Some of these are specific to the automotive industry, but these fields could be used by any industry. There is space to enter data for 2 email sends per month. To start, click Create Eblast Data first, then enter all the data points, and click Save.
You can also upload one of the email images at the bottom of the page so it can be seen on the Executive Summary.
When all of the necessary data has been gathered and entered, navigate back to the Executive Summary tab and click Generate to create the aggregated report.